Dot Blot Analysis with ImageJ
Contributed by Martin Fitzpatrick, University of Birmingham, United Kingdom
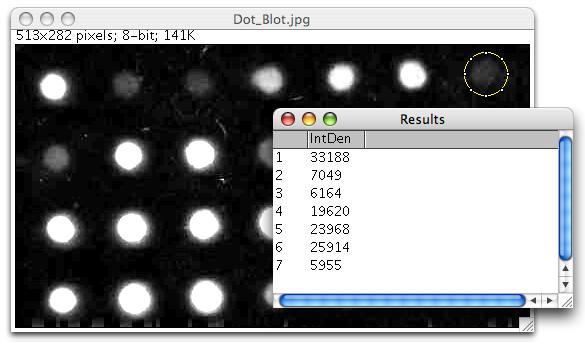
Analyzing a dot blot in ImageJ by background subtraction and measuring the integrated density of each dot.
This dot blot image is available in the File/Open Samples menu in ImageJ 1.33s or later.
Method
- This method usually requires background correction of the image, which can be done using the Process/Subtract Background command.
*See image for profile plots (Analyze/Plot Profile) of the first row of dots before and after background correction was done using the Subtract Background command with the rolling ball radius set to 25 pixels. *
- After correcting the background, enable “Integrated Density” in Analyze/Set Measurements, create a circular selection, drag it over the first dot, press “m” (Analyze/Measure), then repeat for the other 27 dots.
*Notice how the image now has a black background? It was inverted (Edit/Invert) so background pixel values are near zero, which is required for correct calculation of integrated density. You can invert the lookup table (Image/Lookup Tables/Invert LUT) to restore the original appearance of the image. The “Use Inverting Lookup Table” option in Edit/Options/Image will invert the pixel data and invert the lookup table. *
This method is based, with permission, on an original protocol available here.